U.S. Tile Consumption Overview:
Another year of positive news from the U.S. economy, gains in the construction and housing markets, as well as historically low interest rates and falling unemployment, helped the U.S. ceramic tile market increase for the eighth year in a row.
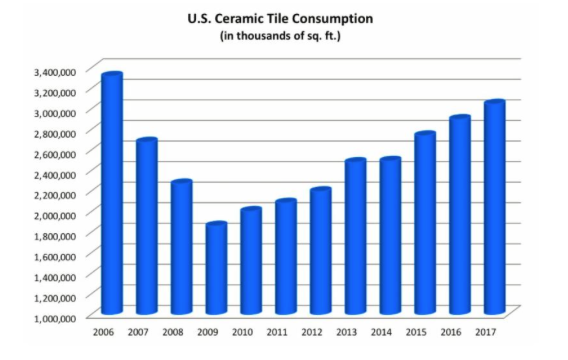
In 2017 U.S. ceramic tile market surpassed the three billion sq. ft. level for the first time since 2006. Total consumption was 3.05 billion sq. ft. (283 million m2), up 5.1% from 2016 and the fourth highest total of all time.1
The following table shows U.S. tile shipments, imports, exports, and total consumption in thousands of sq. ft.
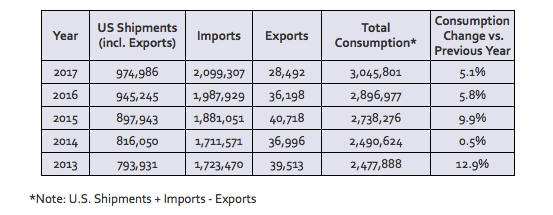 The chart below shows total U.S. consumption of ceramic tile (in sq. ft.) over the last several years.
Imports:
In 2017 the U.S. imported 2.10 billion sq. ft. of ceramic tile, up 5.6% from 2016 (1.99 billion sq. ft.).2
Imports comprised 68.9% of 2017 U.S. tile consumption in sq. ft., up slightly from 68.6% in 2016.
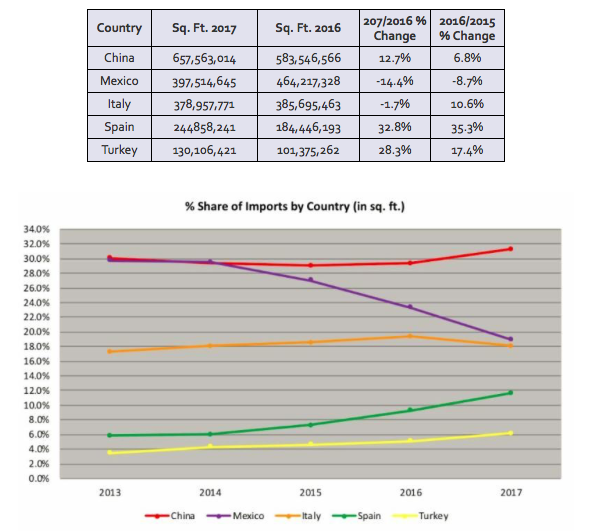
Once again China was the largest exporter to the U.S. in sq. ft., a position it has held since taking over the top spot from Mexico in 2015. Chinese imports in 2017 comprised 31.3% of U.S. imports (in sq. ft.), up from 29.4% the previous year, and the highest percentage China has ever held of the U.S. import market.
While the peso has fallen significantly vs. the U.S. dollar over the last five years, ceramic tile imports from Mexico have declined sharply. Mexican imports comprised 18.9% of 2017 U.S. imports, down from 23.4% in 2016 and down from 27.0% of U.S. imports just two years ago.
Italy was the third largest exporter of tile to the U.S., making up 18.1% of U.S. imports, down from 19.4% in 2016. The next largest exporters to the U.S. in 2017 were Spain (11.7% import share) and Turkey (6.2%).3
The five countries from which the most tiles were imported in 2017 based on sq. ft. were:
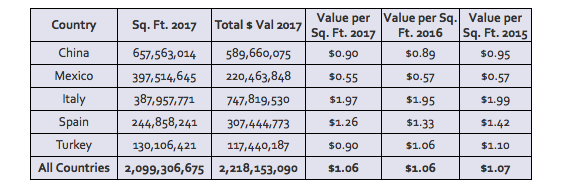
On a dollar basis (including duty, freight, and insurance) Italy remained the largest exporter to the U.S. in 2017, comprising 33.7% of U.S. imports. China was second with a 26.6% share, and Spain was third with a 13.9% share.
The five countries from which the most tiles were imported in 2017 based on total U.S. $ value (including duty, freight, and insurance) were:
The average values of tile4 (including duty, freight, and insurance) from the five countries from which the most tiles were imported (based on sq. ft.) in 2017 were:
U.S. Shipments:
U.S. shipments of ceramic tile rose 4.1% from 2016 to 2017 to a record high of 946.5 million sq. ft. Domestic production, which has increased each of the last eight years, has been boosted recently by the expansion and opening of additional manufacturing facilities in Tennessee.
Domestically-produced tile was by far the tile of choice of consumers, as 31.1% of all tile (by sq. ft.) consumed domestically in 2017 was made in the U.S. The next highest countries of origin were China (21.6% of all tile consumed in the U.S.), Mexico (13.1%), and Italy (12.4%).
In dollar value U.S. FOB factory sales of domestic shipments in 2017 were also at a record high of $1.43 billion, up 6.1% vs. 2016. Domestically-produced tile comprised 39.3% of total U.S. tile consumption by dollar value, almost double that of Italian tile imports, which made up 20.5% of the U.S. market.
The per unit value of domestic shipments increased from $1.49 sq. ft. in 2016 to $1.51 sq. ft. in 2017.5
Exports:
U.S. ceramic tile exports were 28.5 million sq. ft. in 2017, down 21.3% The vast majority of these exports were to Canada (75.3%) and Mexico (8.4%).6
Economic Highlights:
New Home Starts
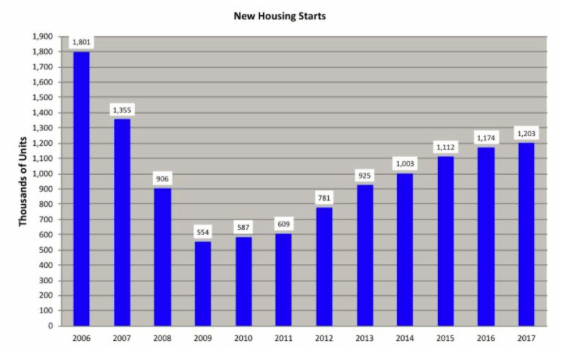
New home starts increased for the eighth year in a row, achieving their highest yearly level in a decade.
There were 1.20 million total housing units started in 2017, up 2.5% from the previous year.Despite the steady year-over-year growth since 2010, new home starts remain down by one third from 2006, the last full year prior to the start of the Great Recession.7
New Single Family Home Sales
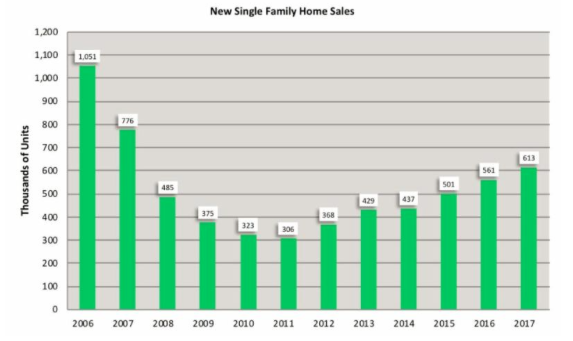
New single family home sales were at a 10-year high of 613,000 units, up 9.3% compared to 2016.Despite this positive news and six consecutive years of growth, new home sales have been slow to recover from the damage wrought by the recession.
For perspective new home sales are less than half of what they were in 2005, when a record 1.28 million new units were sold.8
Foreclosures
Foreclosure filings, one of the main inverse indicators of the U.S. housing market’s health, have fallen dramatically from an all-time high of 2.87 million units in 2010 to 677,000 in 2017.
This was the seventh consecutive year-over-year decline and the lowest annual foreclosure total since 2005.9
________________________________
1 U.S. Dept. of Commerce & Tile Council of North America
2 U.S. Dept. of Commerce
3 U.S. Dept. of Commerce
4 The average value is significantly affected by the mix of tiles imported, with different types of tiles impacting the average value, in addition to differences in pricing for the same types of tile.
5 Tile Council of North America
6 U.S. Dept. of Commerce
7 U.S. Census Bureau
8 U.S. Census Bureau
9 RealtyTrac


