


Though the economic conditions taking place in 2020 in response to COVID-19 will paint a brand new picture of the ceramic tile market this year, TCNA presents a market overview for year 2019.
U.S. Tile Consumption Overview
Many key economic indicators were positive in 2019, as the U.S. economy experienced its tenth consecutive year of expansion on the heels of the Great Recession.
However, the American ceramic tile market did not follow suit and declined for the first time in a decade.
U.S. ceramic tile consumption in 2019 was 2.9 billion sq. ft. (273.2 million m2), down 5.4% from the previous year.1
The following table shows U.S. ceramic tile shipments, imports, exports, and total consumption in thousands of sq. ft.
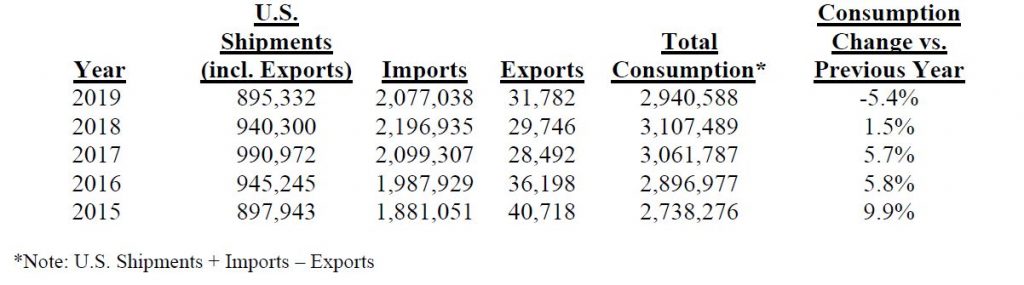
*Note: U.S. Shipments + Imports – Exports
1 U.S. Dept. of Commerce & Tile Council of North America
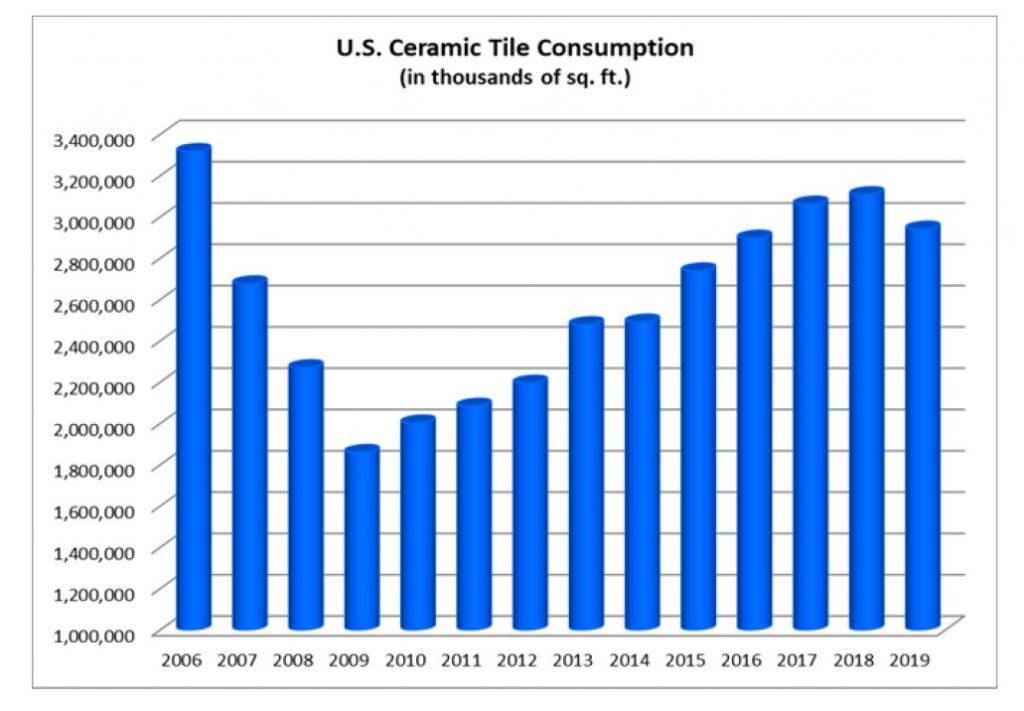
The chart below shows total U.S. consumption of ceramic tile (in sq. ft.) over the last several years.
Imports:
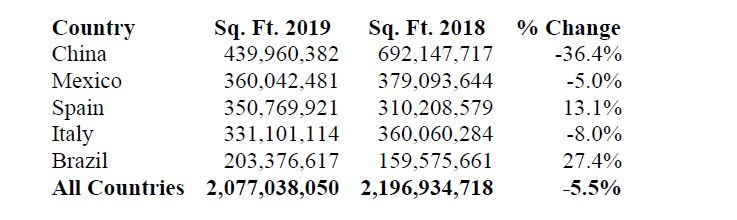
The U.S. imported 2.08 billion sq. ft. (193.0 million m2) of ceramic tile in 2019, down 5.5% from the previous year (2.20 billion sq. ft. or 204.1 million m2).2
Imports comprised 70.6% of 2019 U.S. tile consumption by volume, down from 70.7% in 2018.
2 U.S. Dept. of Commerce
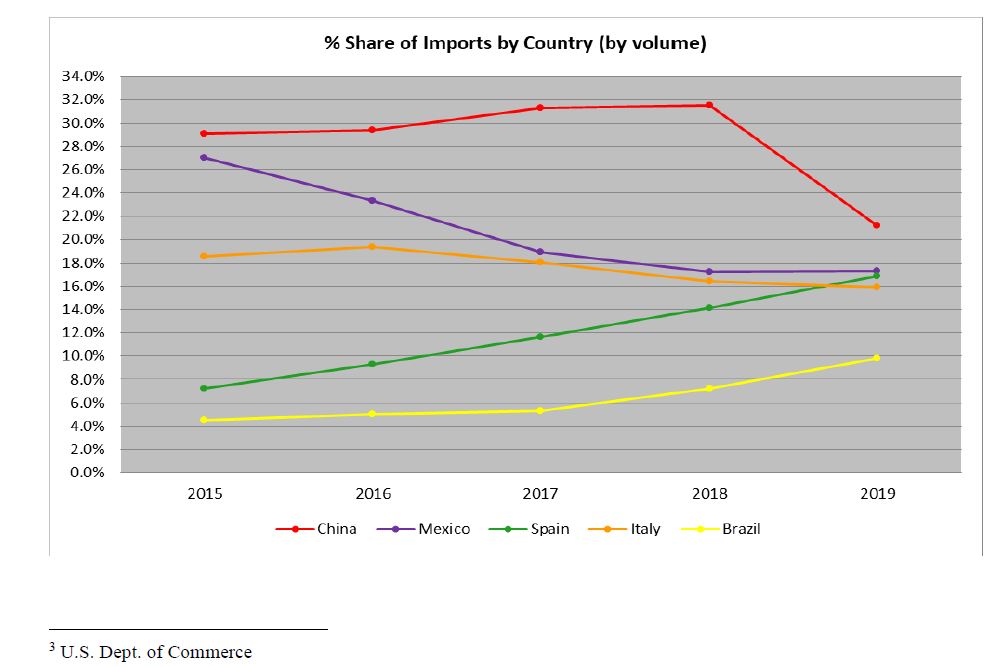
Although China remained the largest exporter of ceramic tile to the U.S. by volume, its exports to the U.S. fell dramatically last year. This was due primarily to the effects of a trade remedy case filed by a coalition of several U.S. manufacturers, which petitioned the federal government to remedy unfairly dumped and subidized ceramic tile imports from China.
The effects of the preliminary countervailing duty (CVD) and anti-dumping determinations, which were announced in Sept. 2019 and Nov. 2019, respectively, are shown in the chart below.
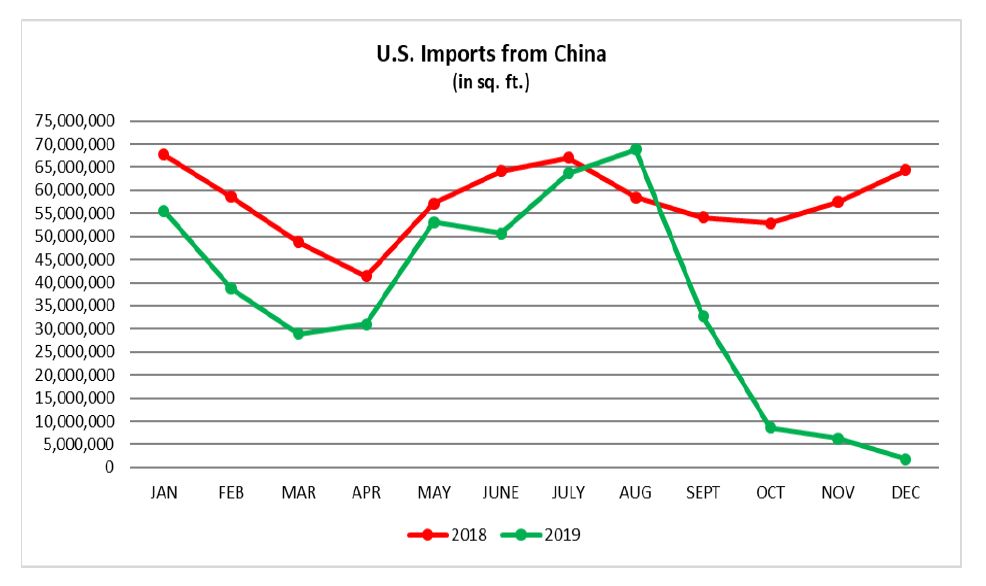
Chinese imports made up 21.2% of total U.S. tile imports by volume in 2019. This was down from 31.5% in 2018 and represented China’s lowest share of U.S. imports since 2008.
Imports from Mexico comprised 17.3% of total U.S. imports in 2019, unchanged from 2018.
Spain surpassed Italy as the third largest exporter of tile to the U.S., making up 16.9% of U.S. imports by volume, up from 14.1% in 2018. The next largest exporters to the U.S. were Italy (15.9% import share) and Brazil (9.8%).3
The five countries from which the most tiles were imported in 2019 based on volume were:
3 U.S. Dept. of Commerce
On a dollar basis (CIF + duty) Italy remained the largest exporter to the U.S. in 2019, comprising 29.6% of U.S. imports. China was second with a 20.3% share, and Spain was third with a 20.1% share.
The five countries from which the most tiles were imported in 2019 based on total U.S. $ value (CIF + duty) were:
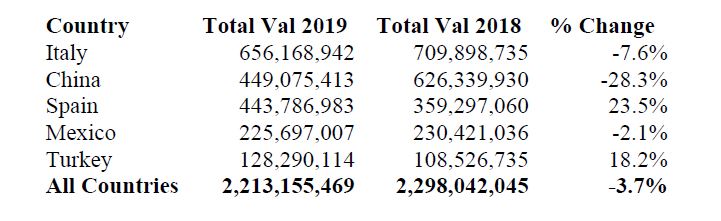
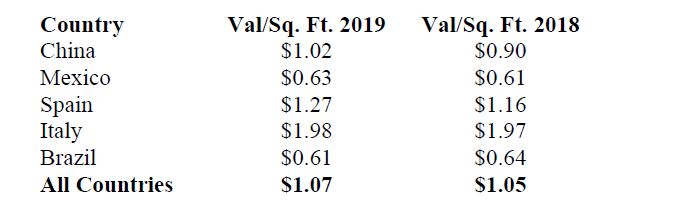
The average values of tile4 (CIF + duty) from the five countries from which the most tiles were imported (based on volume) in 2019 were:
U.S. Shipments:
In 2019 U.S. shipments (less exports) were 863.6 million sq. ft. (80.3 million m2), down 5.2% from 2018. This represented the lowest level of domestic shipments since 2015.
Domestically-produced tile made up 29.4% of total U.S. tile consumption (by volume) in 2019, up slightly from its share the previous year (29.3%).
4 The average value is significantly affected by the mix of tiles imported, with different types of tiles impacting the average value, in addition to differences in pricing for the same types of tile.
In dollar value 2019 U.S. FOB factory sales of domestic shipments were $1.33 billion, down 4.0% compared to 2018. Domestically-manufactured tile made up 37.6% of 2019 total U.S. tile consumption by dollar value.
The per unit value of domestic shipments increased from $1.53/sq. ft. in 2018 to $1.55/sq. ft. in 2019.5
Exports:
U.S. ceramic tile exports were 31.8 million sq. ft. (3.0 million m2) in 2019, up 6.8% from 2018. The two largest recipients of these exports were Canada (70.7%) and Mexico (11.0%).6
Economic Highlights:
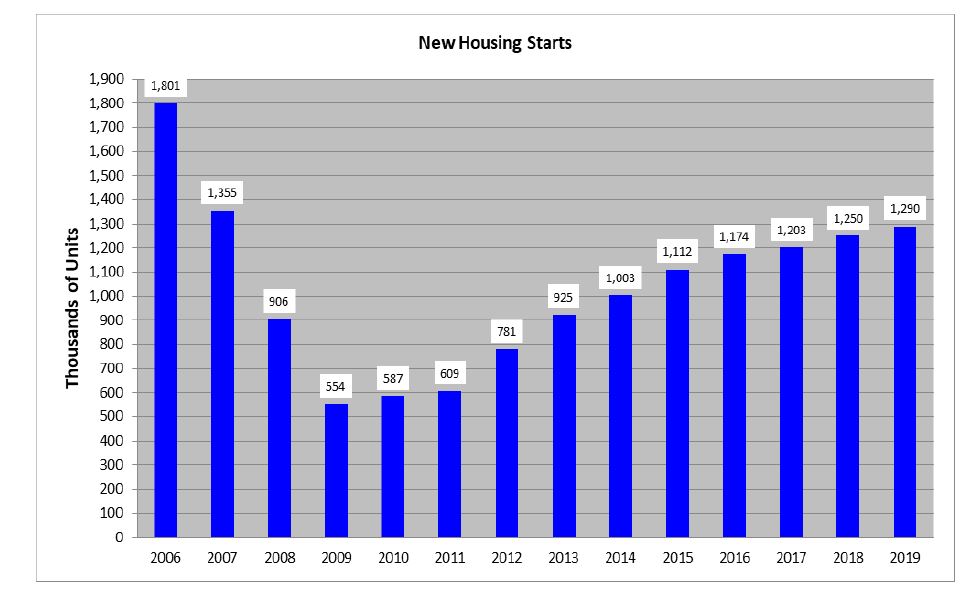
New Home Starts
Total new home starts, which have risen each of the last ten years, were at their highest annual level since 2007 (1.29 million units) and were up 3.2% from the previous year.
Though still down considerably from the record high of 2.1 million starts in 2005, housing starts in 2019 were more than double their level at the beginning of the decade.7
5 Tile Council of North America
6 U.S. Dept. of Commerce
7 U.S. Census Bureau
New Single-Family Home Sales
An additional measure of the residential market’s strength, new single-family home sales were at their highest level in twelve years.
The 682,000 units sold in 2019 represented a robust 10.5% increase from the previous year.8
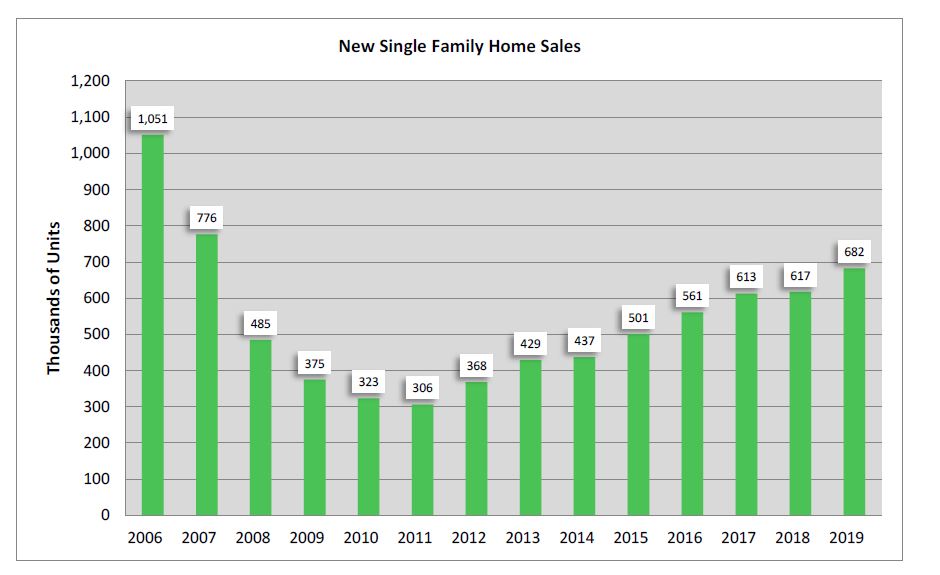
8 U.S. Census Bureau
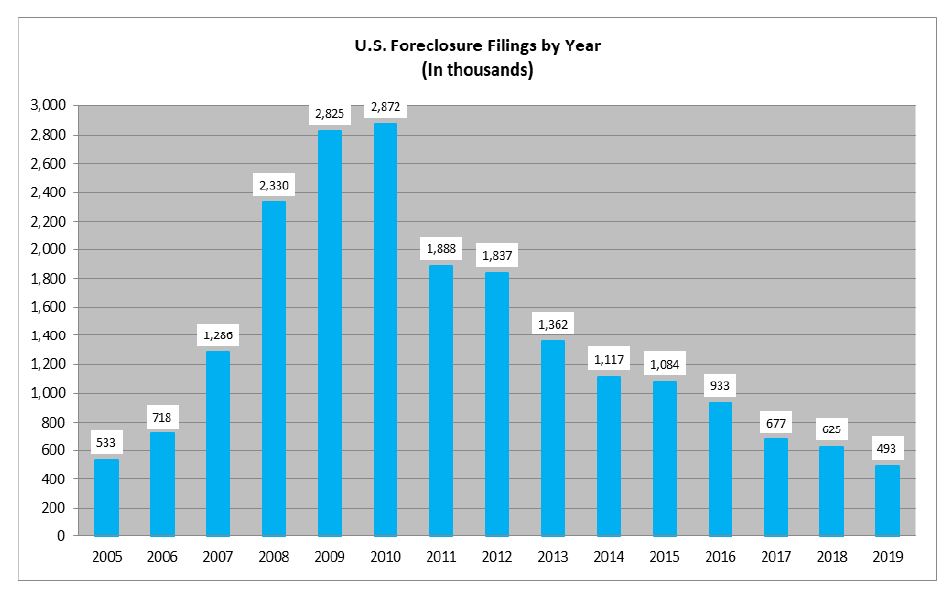
Foreclosures
Another good sign for the U.S. housing market was that foreclosure filings, a key inverse
indicator of the residential market’s health, fell for the ninth straight year and were at their
lowest level since tracking began in 2005.
The 493,000 filings (0.36% of all U.S. housing units) recorded in 2019 reflected a 21.1% decline
from 2018.9


