During a press conference today as part of the quarterly Coverings Connected program, the Tile Council of North America (TCNA) revealed its findings for the 3Q ceramic tile industry.
U.S. Ceramic Tile Consumption Overview:
U.S. ceramic tile consumption through 3Q 2020 was 2.04 billion sq. ft., an 11.6% decline vs. 3Q 2019 YTD, according to the U.S. Department of Commerce and the Tile Council of North America.
The following table shows U.S. tile shipments, imports, exports, and total consumption in thousands of sq. ft.

Imports:
Through 3Q 2020, 1.38 billion sq. ft. of ceramic tile arrived in the U.S., down 15.8% from 3Q 2019 YTD.
Imports through 3Q 2020 comprised 67.9% of U.S. tile consumption (by volume), down from 70.6% in 2019.
Spain was the largest exporter to the U.S. (3Q 2020 YTD) with a 20.7% share of U.S. imports (by volume), followed by Mexico (17.6%) and Italy (17.2%), according to the U.S. Department of Commerce.
The following chart shows the % share of U.S. imports by volume for select countries.
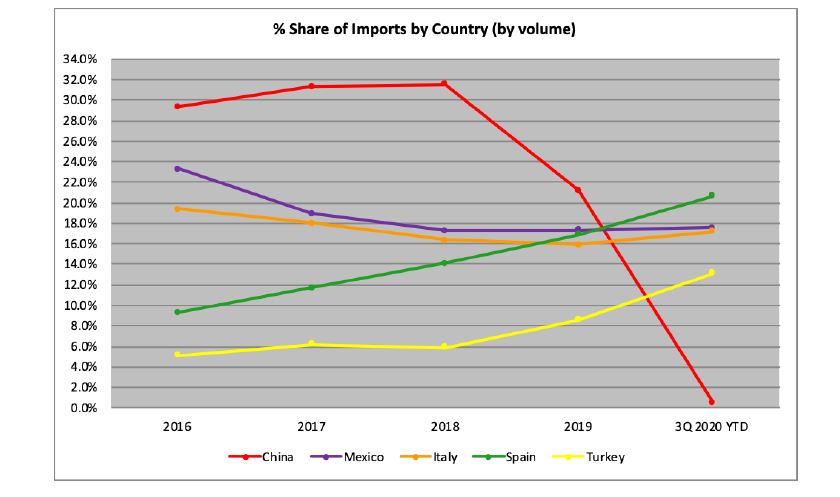

The five countries from which the most tiles were imported through 3Q 2020 based on volume were:


Italy remained the largest exporter to the U.S. on a dollar basis (CIF + duty) through 3Q 2020, comprising 32.3% of U.S. imports, followed by Spain (23.1% share) and Mexico (11.4% share).
The five countries from which the most tiles were imported 3Q 2020 YTD based on total U.S. $ value (CIF + duty) were:


The average values of tile (CIF + duty) from the five countries from which the most tiles were imported (based on volume) through 3Q 2020 were as follows. The average value is significantly affected by the mix of tiles imported, with different types of tiles impacting the average value, in addition to differences in pricing for the same types of tile:


U.S. Shipments:
U.S. shipments (less exports) 3Q 2020 YTD were 654.5 million sq. ft., down 1.5% vs. 3Q 2019 YTD.
The $ value/sq. ft. of U.S. shipments (less exports) through 3Q 2020 was $1.49, down from $1.54 (3Q 2019 YTD).
According to the U.S. Dept. of Commerce & Tile Council of North America, U.S.-produced tile comprised 32.1% of U.S. ceramic tile consumption by volume through 3Q 2020 and 40.8% by $ value.
Exports:
U.S. ceramic tile exports through 3Q 2020 were at 23.5 million sq. ft., up 4.4% from 3Q 2019 YTD. The vast majority of these exports were to Canada (71.2%) and Mexico (10.5%), according to the U.S. Department of Commerce.
Economic Highlights:
