
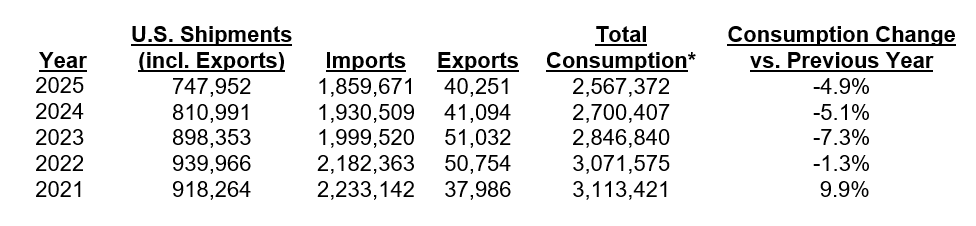
U.S. ceramic tile consumption in 2025 was 2.57 billion sq. ft., down 4.9% from the previous year.1
The following table shows U.S. tile shipments, imports, exports, and total consumption in thousands of sq. ft.
Imports2
U.S. ceramic tile imports were at 1.86 billion sq. ft. in 2025, a 3.7% decline from the prior year.
Imports comprised 72.4% of 2025 U.S. tile consumption by volume, up from 71.5% in 2024.
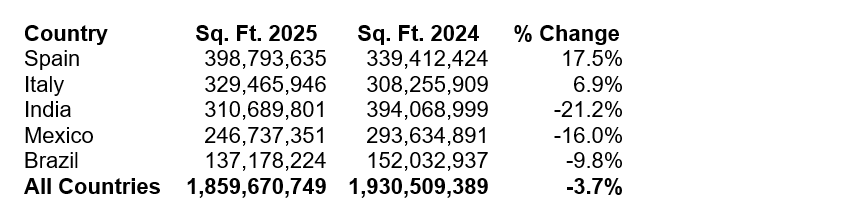
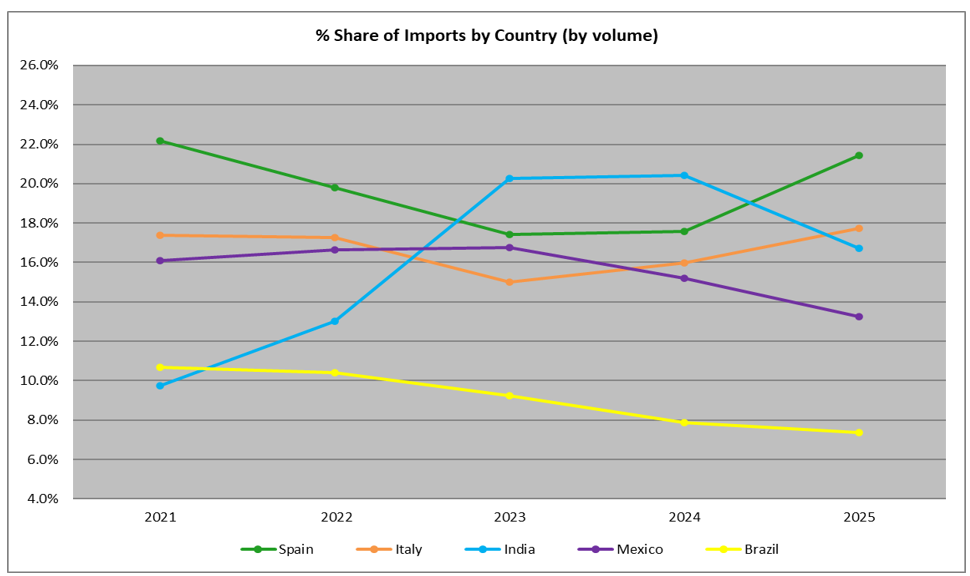
Spain once again became the largest exporter to the U.S. by volume, accounting for 21.4% of 2025 imports, followed by Italy (17.7%), and India (16.7%).
The five countries from which the most tiles were imported in 2025 based on volume were:
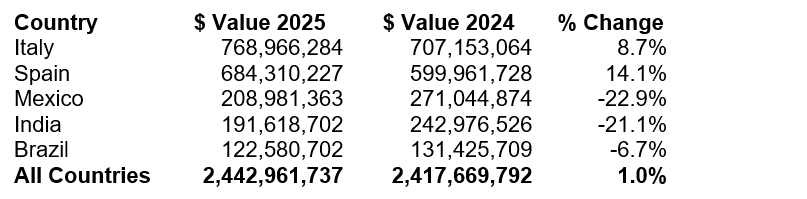
Italy remained the largest exporter to the U.S. on a dollar basis (CIF + duty), comprising 31.5% of 2025 U.S. imports, followed by Spain with a 28.0% share and Mexico (8.6% share).
The five countries from which the most tiles were imported in 2025 based on total U.S. $ value (CIF + duty) were:
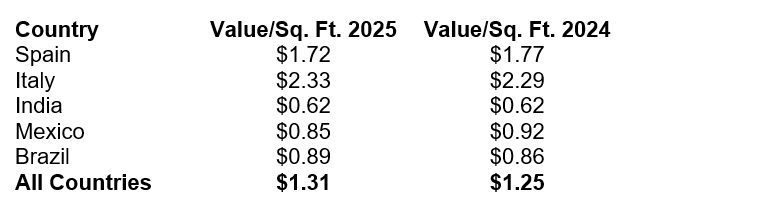
The average per unit value of tile3 (including CIF + duty) from the five countries from which the most tiles were imported by volume in 2025 were:
U.S. Shipments4
In 2025 U.S. manufacturers shipped 707.7 million sq. ft. of ceramic tile domestically, down 8.1% from the prior year and the lowest annual total since 2012.
U.S. shipments’ share of total U.S. consumption by volume last year was 27.6%, down from 28.5% in 2024. Despite this, domestically produced tiles’ share of total U.S. consumption far outpaced the shares of any individual country exporting to the U.S. The next highest shares of total consumption by volume were held by Spain (15.5%), Italy (12.8%), and India (12.1%).
By value, 2025 U.S. FOB factory sales of domestic shipments (less exports) were $1.32 billion, a 4.0% decrease from the previous year. U.S. shipments comprised 35.1% of total U.S. tile consumption by value, down from 36.2% in 2024.
The per unit value of domestic shipments (less exports) in 2025 was $1.86/sq. ft., up from $1.79/sq. ft. the previous year.
U.S. Exports5
U.S. ceramic tile exports in 2025 were 40.3 million sq. ft., down 2.1% from the previous year. The primary recipients of U.S. exports were Canada (65.6%), Italy (11.9%), and Mexico (11.6%).
The value of U.S. exports increased 5.6% to $48.9 million over the same timeframe.
About Tile Council of North America (TCNA)
TCNA is a trade association representing manufacturers of ceramic tile, tile installation materials, tile equipment, raw materials, and other tile-related products. Established in 1945 as the Tile Council of America (TCA), it became the Tile Council of North America (TCNA) in 2005, reflecting its membership expansion to all of North America.
The Tile Council is recognized for its leadership role in facilitating the development of North American and international industry quality standards to benefit tile consumers. Additionally, TCNA regularly conducts independent research and product testing, works with regulatory, trade, and other government agencies, and publishes installation guidelines, tile standards, economic reports, and promotional literature.
1 U.S. Dept. of Commerce & Tile Council of North America
2 U.S. Dept. of Commerce
3 The average value is significantly affected by the mix of tiles imported, with different types of tiles impacting the average value, in addition to differences in pricing for the same types of tile.
4 Tile Council of North America
5 U.S. Dept. of Commerce