



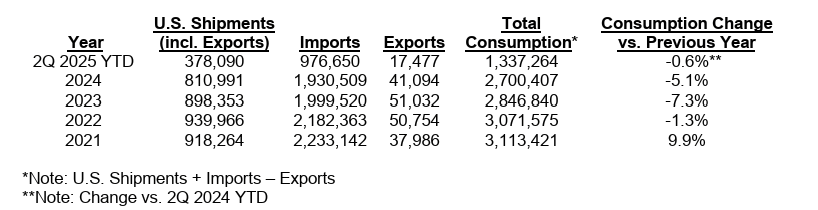
(Clemson, SC) – The Tile Council of North America (TCNA) has announced U.S. ceramic tile consumption 2Q 2025 YTD was 1.34 billion sq. ft., down 0.6% from 2Q 2024 YTD (1).
The following table shows U.S. tile shipments, imports, exports, and total consumption in thousands of sq. ft.
Imports(2)
2Q 2025 YTD U.S. ceramic tile imports were at 976.7 million sq. ft., up 2.6% by volume vs. 2Q 2024 YTD.
Import penetration by volume 2Q 2025 YTD was 73.0%, up from 70.8% 2Q 2024 YTD.
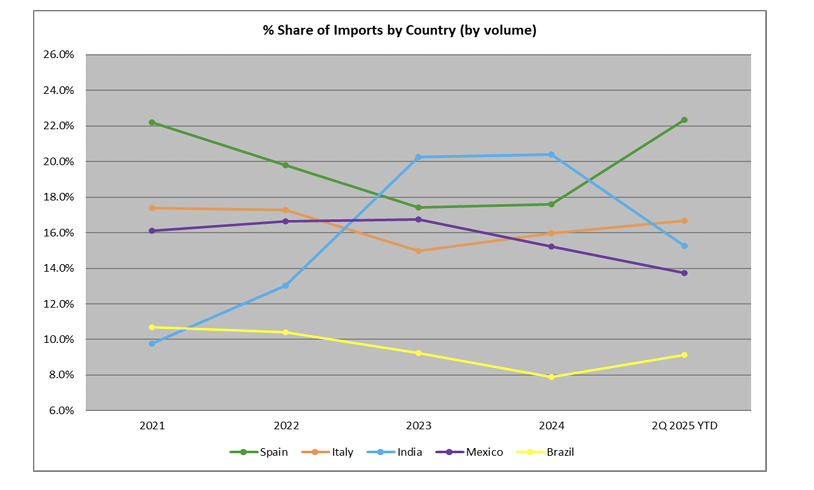
Spain was the largest exporter by volume to the U.S. 2Q 2025 YTD with a 22.3% share of U.S. imports, followed by Italy (16.7%), and India (15.3%).

The five countries from which the most tiles were imported 2Q 2025 YTD based on volume were:

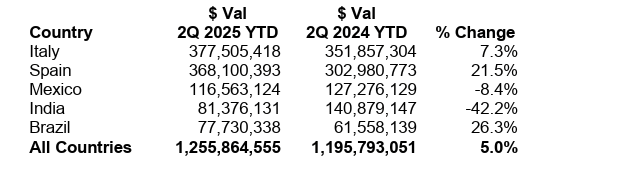
Italy was the largest exporter on a dollar basis (CIF + duty), comprising 30.1% of 2Q 2025 YTD U.S. imports, followed by Spain with a 29.3% share, and Mexico (9.3% share).
The five countries from which the most tiles were imported 2Q 2025 YTD based on total U.S. $ value (CIF + duty) were:
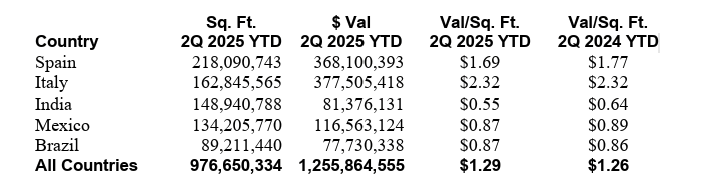
The average values of tile3 (including CIF + duty) from the five countries from which the most tiles were imported by volume 2Q 2025 YTD were:
U.S. Shipments(4)
U.S. shipments (less exports) 2Q 2025 YTD were 360.6 million sq. ft., down 8.3% vs. 2Q 2024 YTD.
U.S. FOB factory sales of domestic shipments (less exports) 2Q 2025 YTD were $666.1 million, down 4.8% vs. 2Q 2024 YTD.
The $ value/sq. ft. of 2Q 2025 YTD domestic shipments (less exports) was $1.85, up from $1.78 2Q 2024 YTD.

U.S. Exports(5)
U.S. ceramic tile exports 2Q 2025 YTD were 17.5 million sq. ft., a 17.6% decrease from 2Q 2024 YTD. The two largest consumers of U.S. exports by volume were Canada (75.3% share) and Mexico (11.8% share).







 has announced U.S. ceramic tile consumption 2Q 2025 YTD was 1.34 billion sq. ft., down 0.6% from 2Q 2024 YTD (1).)